

Biotech is outperforming again. In 2025, the sector beat the S&P 500 for the first time since 2020, and the momentum has carried into this year: the XBI, an actively managed ETF tracking a broad basket of US biotech stocks, is up +25 percent YTD in 2026 and has outperformed the SP&500 by roughly 20 percent, on top of a 19 percent relative gain last year.1 Prices rallied into year-end 2025, but capital did not follow. Flows stayed flat to negative through the first half of 2026, and cumulative flows remain deeply negative over the longer term.2 The market is behaving like a recovery while most investors remain standing on the sidelines.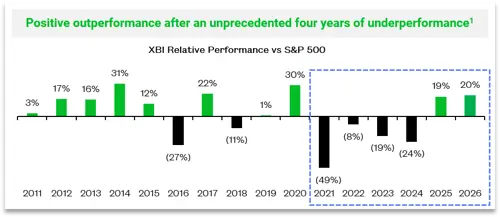
Figure 1 Bar chart of XBI performance relative to the S&P 500 by year from 2011 to 2026, showing outperformance of 19 percent in 2025 and 20 percent in 2026 after four consecutive negative years.
There are reasons for generalist investor caution, namely geopolitical uncertainty, rate uncertainty, healthcare policy uncertainty, inability to assess the fundamentals with great depth, and distraction by dazzling tech sectors that have sucked up all of the growth capital. For the savvy and contrarian investor, however, that gap is the opportunity. A sector can outperform for two consecutive years and still be early if the capital that left has not returned, and valuations still reflect that absence, with much of the sector trading at levels set during the downturn. Four forces are driving the biotech recovery: a more stable FDA, a reopened IPO market, an active M&A engine, and, above all, commercial drug launches that are beating prior cycles. The strong biotech sector performance differs in character from the 2020 to 2021 boom: it is led by companies with approved products, credible paths to profitability, and later-stage science, a maturity the sector did not have in prior cycles.
Valuations Are Attractive
The NBI, the Nasdaq index of larger biotech companies, shows a price-to-sales ratio that is off its lows but still only mid-range against its own history, a modest level given how far the underlying science has advanced.3 Roughly 30 percent of US biotech companies under $10 billion in market capitalization still trade below the value of the cash on their balance sheets.4 High dispersion is the signature of a stock picker’s market. That combination of a large share of undervalued companies alongside improving fundamentals is where the gap between winners and losers drives returns more than the direction of the index.
A More Stable FDA Takes Shape
The regulatory overhang that weighed on the sector through 2025 has lifted. Approvals kept pace and then accelerated: 23 novel drugs were approved in the first half of 2026, the highest first-half total since 2023 and up from 16 in the first half of 2025.5 Turnover of FDA leadership comes with a different philosophy toward rare disease in particular, and recent agency decisions have reversed earlier negative rulings on programs from uniQure6 and REGENXBIO.7 On August 6 the FDA granted accelerated approval to Replimune’s RP1, marketed as Tudriqev, for advanced melanoma that has progressed on anti-PD-1 therapy.8 Staffing is also recovering: the agency’s drug-review center added more than 100 employees in a single quarter for the first time since late 2024.9
The IPO Market Has Returned
The IPO market has reopened, with 15 offerings through July 31, 2026, against just 8 in all of 2025, and second-quarter dollar volume reached its highest level since the third quarter of 2021.10 Kailera Therapeutics, an obesity medicines developer in which RTW holds a financial interest, priced at the high end of its range, upsized, and raised $625 million. Parabilis Medicines surpassed it weeks later.11 Two record-scale offerings in a single quarter point to a durable reopening following a lengthy period with few exit prospects. At the current pace, 2026 would finish just below a normal biotech IPO year of 30 to 50 offerings, consistent with a recovery still building.12
Two Forces Driving M&A
Mergers and acquisitions drove biotech’s outperformance in the first half, and the structural drivers suggest continuation. Year-to-date deal value has reached approximately $105 billion, approaching the $126 billion recorded across all of 2025.13 Three acquisitions above $10 billion have closed or been announced this year, at average premiums of 46 percent.14 Eli Lilly alone has completed nine deals worth just under $25 billion.15
Two forces power this activity. The first is the patent cliff: products representing approximately $180 billion of big-pharma revenue lose exclusivity by 2030, and annual losses grow materially from the roughly $18 billion that came off in 2025.16 The second is available cash generated from profitable franchises, such as Eli Lilly's obesity portfolio, which has given the largest acquirers substantial acquisition capacity. This activity is currently the recovery’s primary funding mechanism.
Average beat versus pre-launch revenue consensus | |
|---|---|
+151% | Drugs launched between 2023 to 2025 |
+50% | Drugs launched over prior eight years |
Source: LifeSci Capital, 'Analysis of First-Approval Drug Launches,' June 2026 | |
The most consequential and underappreciated shift is happening after drugs get approved. Small- and mid-cap biotech companies now account for 50 to 60 percent of all novel drug approvals.17 Roughly 40 percent of XBI constituents have at least one approved product, and Cantor Fitzgerald projects that figure could reach 80 percent within 18 months.18 The industry is maturing into a commercial sector in real time.
The launches themselves are outperforming. Drugs launched between 2023 and 2025 have beaten pre-launch revenue consensus by 151 percent on average, versus 50 percent over the prior eight years.19 The launch rate has nearly doubled, to 7.3 launches per year since 2023 from a historical 3.8.20 TD Cowen’s analysis of more than 80 approvals from 2020 to 2025 found post-approval returns averaging 34 percent at one year and 44 percent at two years, a dramatic improvement over the 2014 to 2018 cycle, when the same measures were 6 percent and negative 9 percent.21 A launch now marks an inflection point for value creation rather than a peak.
Outcomes are far from uniform, and that is the point. The gap between winners and losers is wide, driven by identifiable factors: the quality of the medicine, the size and accessibility of the market, and the competence of commercial execution. Novel drugs, disruptors, and first-in-class products are driving commercial success. This is a substantial improvement from a decade ago when commercial products were often me too or me better drugs, or modest improvements to a drug like an extended-release formulation. For investors who can assess which launches will succeed, this growing group of companies is a widening opportunity. And as biotech increasingly resembles a sustainable revenue and earnings-growth sector, it can begin to compete for generalist capital against other profitable growth sectors, which is what ultimately reverses the fund-flow picture.
Structural Forces Behind the Biotech Recovery
The cyclical evidence sits on top of a structural foundation. As Rod Wong argued in Fortune in July, medicine is entering a golden age of innovation enabled by four mega-trends: cheap genetic information, a boom in new drug modalities, artificial intelligence, and the globalization of drug discovery.22 Genome sequencing that once cost $3 billion now costs around $200, making the genetic roots of disease targetable at scale. New modalities, from cell and gene therapies to antibody drug conjugates and oral peptides, have more than tripled the ways diseases can be treated.23
Artificial intelligence, meanwhile, will have its biggest near-term impact in an unglamorous place: clinical-trial efficiency. Of the roughly seven years a drug spends in trials, about two are consumed by administrative work and more than half of the remainder by patient enrollment. Fewer than 5 percent of cancer patients enroll in trials despite more than 70 percent expressing willingness.24 And 80 percent of cancer patients are treated at community cancer centers who do not have the same speed and access to trials that might be taking place at integrated cancer centers at research hospitals. AI applied to medical records and trial administration can compress that timeline, accelerate the entire innovation cycle and ultimately better serve patients.
What to Watch in the Second Half
Fund flows: whether the early-July inflow, one of the largest weekly inflows of the year, marked the start of a durable generalist rotation.25
IPO cadence: whether the market sustains a pace consistent with a normal year.
FDA throughput: approval counts and review timelines as the signal of a durably stable regulatory environment.
Launch execution: revenue trajectories for the 2025 and 2026 launch cohort against consensus expectations.
Recoveries built on sentiment fade when sentiment turns. This one is built on approved drugs generating revenue, acquirers with structural reasons to buy, and a scientific engine producing more medicines faster than at any point in the industry’s history. For investors who can distinguish the durable winners within that dispersion, biotech is back, and this time the fundamentals mean it.
Takeaway: Biotech is maturing into a commercial sector in real time. The market has not repriced it yet.
Disclosure: RTW has a financial interest in Kailera Therapeutics. This article is for informational purposes only and does not constitute investment advice or an offer or solicitation to buy or sell any security. Statements reflect RTW’s views and opinions as of the date hereof. All expressions of opinion are subject to change without notice and are not intended to be a forecast of future events or results. Past performance is not indicative of future results.
1 Bloomberg as of July 31, 2026.
2 Raymond James weekly sector fund flow reports (weekly and year-to-date figures), July 1, 2026
3 Bloomberg as of June 30, 2026. The characterization of this level as modest reflects RTW’s view.
4 Bloomberg as of June 30, 2026.
5 FDA, Novel Drug Approvals for 2026, 1H 2026 versus 1H 2025. Center for Drug Evaluation and Research. Available at: https://www.fda.gov/drugs/novel-drug-approvals-fda/novel-drug-approvals-2026
6 uniQure N.V., uniQure Announces Plan for BLA Submission for AMT-130 in Huntington’s Disease,’ June 17, 2026. https://uniqure.gcs-web.com/news-releases/news-release-details/uniqure-announces-plan-bla-submission-amt-130-huntingtons
7 REGENXBIO Inc., ‘REGENXBIO Announces Alignment with FDA on Path Forward for NAVSUNLI BLA Resubmission for Accelerated Approval,’ June 22, 2026. https://ir.regenxbio.com/news-releases/news-release-details/regenxbio-announces-alignment-fda-path-forward-navsunlitm-bla
8 U.S. Food and Drug Administration, 'FDA Approves New Engineered Viral Immunotherapy for Patients with Treatment-Resistant Advanced Melanoma,' August 6, 2026. https://www.fda.gov/news-events/press-announcements/fda-approves-new-engineered-viral-immunotherapy-patients-treatment-resistant-advanced-melanoma
9 CDER quarterly staffing additions. Endpoints News, July 2026.
10 LifeSci Capital and Raymond James Report, July 31, 2026
11 Kailera Therapeutics, Inc. Form 8-K, April 20, 2026. Gross proceeds $718.8 million at $16.00 per share, including the underwriters’ overallotment. Initial pricing was reported at $625 million. Parabilis Medicines IPO: SEC filings.
12 Normal-year IPO range of 30 to 50 offerings. RTW estimate.
13 Biopharma M&A deal value, 2026 year-to-date versus full-year 2025. LifeSci Capital and Jefferies reports, July 2026.
14 Deals above $10 billion and average premium. LifeSci Capital and Jefferies reports, July 2026.
15 Eli Lilly acquisition count and aggregate value. LifeSci Capital and Jefferies reports, July 2026.
16 Big-pharma loss of exclusivity, 2025 and cumulative through 2030. Jefferies report, 2024.
17 Share of novel approvals from small- and mid-cap biotech. RTW estimate based on FDA data, 2021 to 2023.
18 Cantor Fitzgerald, 'Biotech's Future's Still Bright: Revisiting Our XBI Weighted Sector Projections,' March 2026.
19 LifeSci Capital, 'Analysis of First-Approval Drug Launches,' June 2026.
20 LifeSci Capital, 'Analysis of First-Approval Drug Launches,' June 2026.
21 TD Cowen, 'To Be or Not to Be, Short the Launch Revisited,' May 2026.
22 Roderick Wong, MD, 'When 10,000 doctors stood up and cheered for a cancer drug,' Fortune, July 25, 2026. https://fortune.com/2026/07/25/pancreatic-cancer-drug-innovation-treadmill-policy-risk/
23 Genome sequencing cost: National Human Genome Research Institute, DNA Sequencing Costs: Data. Expansion of drug modalities: Roderick Wong, MD, Fortune, July 25, 2026. https://www.genome.gov/about-genomics/fact-sheets/DNA-Sequencing-Costs-Data
24 Ebrahimi H, Megally S, Plotkin E, et al. Barriers to Clinical Trial Implementation Among Community Care Centers. JAMA Netw Open. 2024;7(4):e248739. doi:10.1001/jamanetworkopen.2024.8739
25 Weekly biotech fund flows, early July 2026. Raymond James report, July 8, 2026.

